Environment
Climate change presents concrete challenges for companies. The TX Group is committed to using natural resources responsibly and gradually reducing its greenhouse gas emissions. In doing so, we follow recognized standards and continue to develop our measures in line with the evolution of our business activities. We report transparently on our progress and objectives as part of our non-financial reporting.
General conditions
TX Groupʼs current environmental reporting is influenced by two important external and internal factors: on the one hand, the proposed changes to Swiss regulations (external influence) and on the other hand, the operational performance of our Group (internal factor).
Proposed changes to Swiss regulations
The Task Force on Climate-related Financial Disclosures (TCFD), which guided our strategy for reporting on climate issues in the past, has now been disbanded. Although the International Financial Reporting Standards (IFRS) are to replace the TCFDs, the details of this transition are still unclear. Therefore, our current approach to climate disclosures in future reports may need to be adapted to new frameworks or guidelines that arise from the IFRS.
Development at TX Group
The TX Group is in a phase of transformation with the goal of sustainably securing the economic viability of its individual business units. As part of the transformation, two of the three printing centers will be closed. This structural change directly affects our emissions structure and our ecological footprint. Upon completion of the implementation, we will redefine our baseline and review and further develop our sustainability goals and climate reporting accordingly.
Calculation of the environmental footprint
The calculation of the environmental footprint takes into account data and information from the fully consolidated companies of TX Group. Any exceptions are identified and flagged separately.
The calculated data covers emissions related to the following areas:
- Operational processes (Scope 1 and 2)
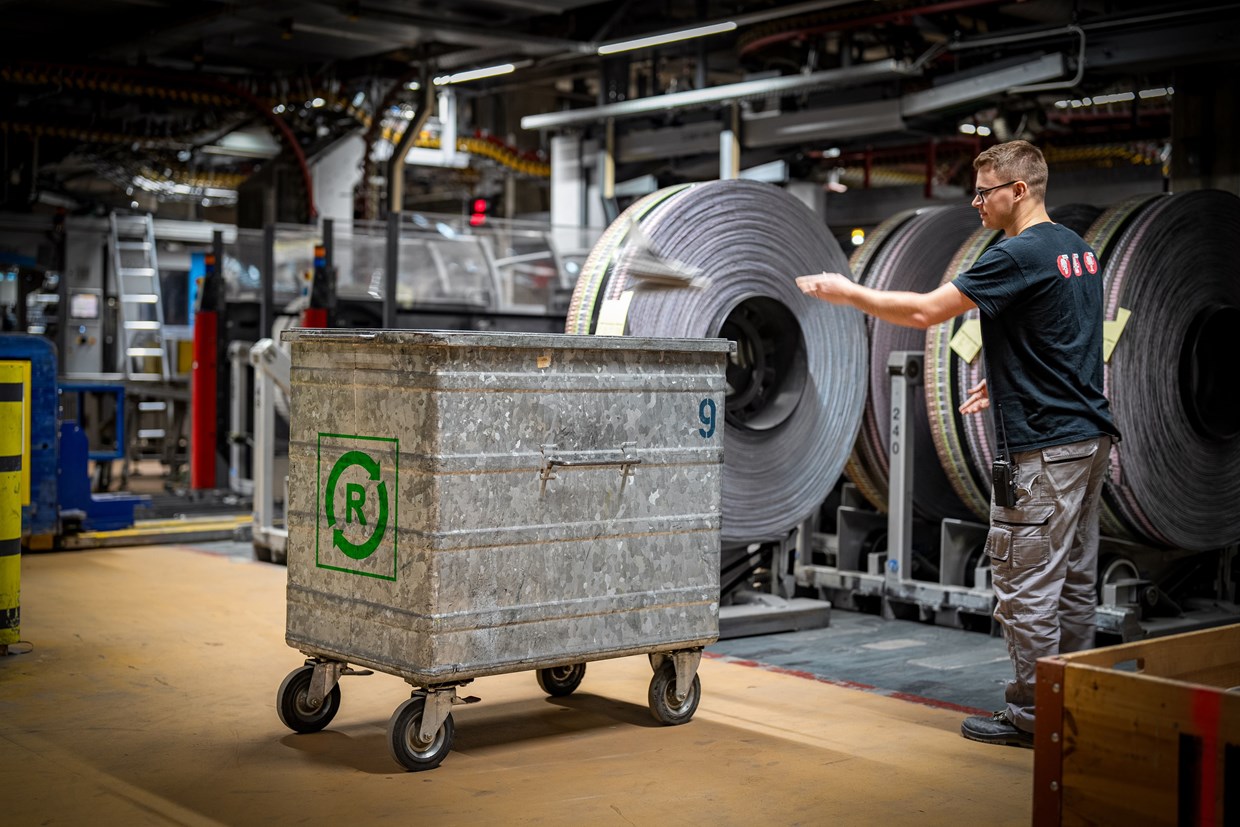
- Selected upstream and downstream emissions (Scope 3) such as employee mobility, the use of inks, aluminium plates, paper and other materials, and the production and transportation of newspapers.
- The provision and use of digital news products such as e-papers, apps and websites.
Primary data included in the calculation:*
- Locations with more than 100 employees
- Additional departments that request a footprint calculation based on primary data.
Total emissions of the Group from Scope 1, 2 and 3*
2024 | 2025 | Change in % | |
|---|---|---|---|
Total Scope 1 | |||
greenhouse gas emissions in tCO2 equivalent | 3’511 | 702 | -80% |
Heat & Cold | 549 | 444 | -19% |
Transportation | 2’962 | 258 | -91% |
Total Scope 2 | |||
greenhouse gas emissions in tCO2 equivalent | 550 | 535 | -3% |
Electricity | 464 | 298 | -36% |
District heating | 84 | 235 | 180% |
Transportation | 2 | 2 | -3% |
Total Scope 3 | |||
greenhouse gas emissions in tCO2 equivalent (by category) | 59’757 | 56’085 | -6% |
Electricity | 711 | 584 | -18% |
Digital work (cloud storage) | 116 | 83 | -28% |
Heat & Cold | 112 | 155 | 38% |
Mobility (including home office) | 3’062 | 2’703 | -12% |
Transportation | 2’475 | 4’260 | 72% |
Beverages & Food | 389 | 390 | 0% |
Material | 49’223 | 44’795 | -9% |
Waste & Recycling | 570 | 334 | -41% |
Use of digital products - energy consumption for end users | 3’097 | 2’780 | -10% |
Total greenhouse gas emissions in tCO2 equivalent | 63’818 | 57’321 | -10% |
Total emissions by company
2024 | 2025 | Total Change in % | |
|---|---|---|---|
Group | |||
Scope 1 by company | 3’511 | 702 | -80% |
Scope 2 by company | 550 | 535 | -3% |
Scope 3 by company | 59’757 | 56’085 | -6% |
Total greenhouse gas emissions in tCO2 equivalent | 63’818 | 57’321 | -10% |
Tamedia | |||
Scope 1 by company | 2’802 | 217 | -92% |
Scope 2 by company | 237 | 329 | 38% |
Scope 3 by company | 46’190 | 44’999 | -3% |
Total greenhouse gas emissions in tCO2 equivalent | 49’230 | 45’544 | -7% |
20 Minuten | |||
Scope 1 by company | 238 | 26 | -89% |
Scope 2 by company | 39 | 21 | -46% |
Scope 3 by company | 9’480 | 6’978 | -26% |
Total greenhouse gas emissions in tCO2 equivalent | 9’757 | 7’025 | -28% |
Goldbach | |||
Scope 1 by company | 375 | 361 | -4% |
Scope 2 by company | 185 | 107 | -42% |
Scope 3 by company | 2’509 | 2’877 | 15% |
Total greenhouse gas emissions in tCO2 equivalent | 3’069 | 3’345 | 9% |
Group & Ventures | |||
Scope 1 by company | 27 | 31 | 14% |
Scope 2 by company | 85 | 75 | -12% |
Scope 3 by company | 1’067 | 902 | -16% |
Total greenhouse gas emissions in tCO2 equivalent | 1’179 | 1’007 | -15% |
TX Markets | |||
Scope 1 by company | 68 | 66 | -3% |
Scope 2 by company | 4 | 4 | 5% |
Scope 3 by company | 511 | 330 | -35% |
Total greenhouse gas emissions in tCO2 equivalent | 583 | 400 | -31% |
Greenhouse gas emissions (Scope 1, 2 and 3)
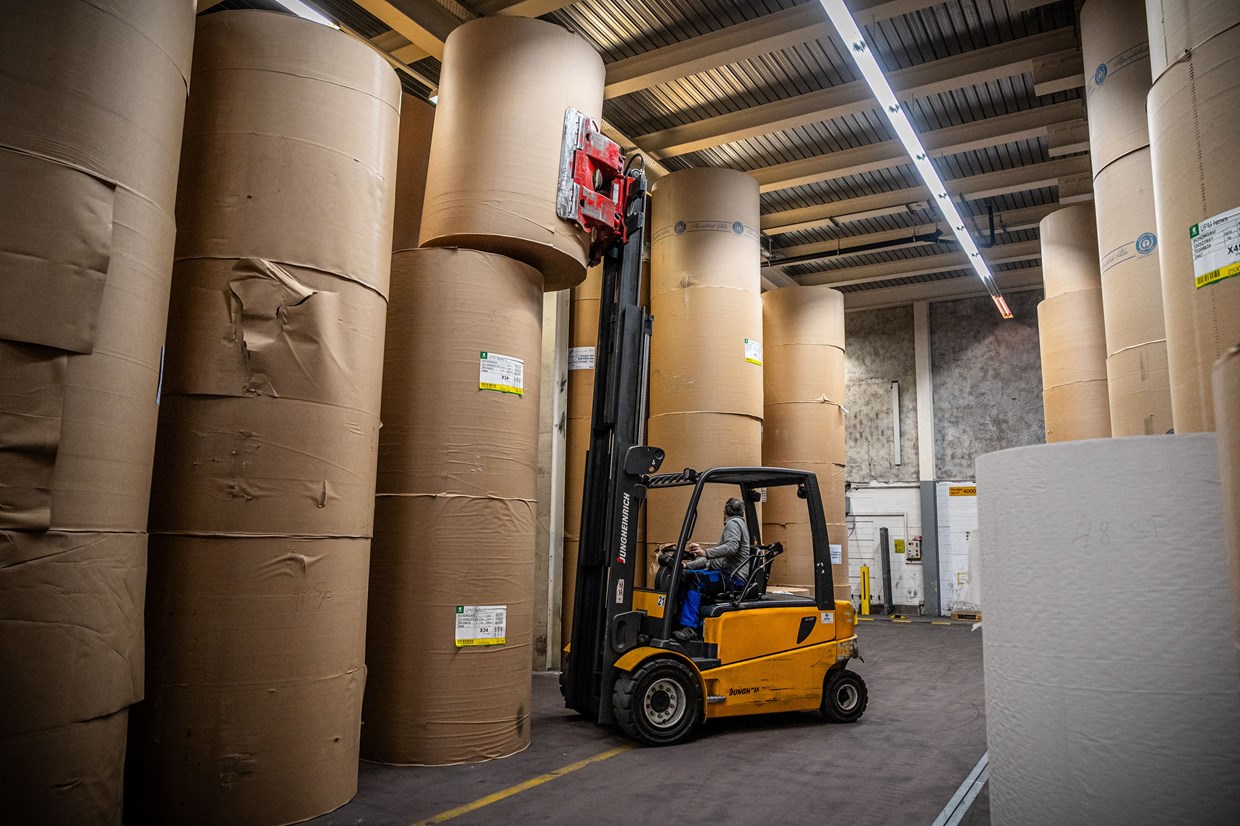
In 2025, the TX Group reduced its total emissions by 10% compared to the previous year. This decrease is mainly due to lower consumption of newsprint, as well as reduced emissions for printing plates, printing inks, developers and finishers. By contrast, emissions in the area of digital products increased due to higher usage.
Material and energy footprint in detail
2024 | 2025 | Change in % | |
|---|---|---|---|
Material | |||
Paper usage in tonnes | 43’823 | 39’528 | -10% |
CO2-intensity: tCO2e per t print products | 1.46 | 1.45 | -0% |
Recycled paper share | 90% | 90% | 0% |
Paper purchased and printed for third parties (share in %) | 53% | 56% | 7% |
Printing plates (in tons) | 207 | 196 | -5% |
Printing inks (in tons) | 1’242 | 1’132 | -9% |
Paper consumption decreased significantly. The CO₂ intensity per tonne of print products produced fell marginally, as the volume of print products fell more sharply than total emissions.
2024 | 2025 | Change in % | |
|---|---|---|---|
Power | |||
Electricity in kWh | |||
Renewable energy consumption | 5’520’670 | 4’222’546 | -24% |
Conventional electricity consumption (CH Mix) | 20’497’992 | 18’761’425 | -8% |
Total consumption | 26’018’662 | 22’983’971 | -12% |
Heat & Cold | |||
Heating oil (in l) | 92’638 | 69’944 | -24% |
Natural gas (in kWh) | 565’599 | 433’738 | -23% |
Biogas (in kWh) | 234’734 | 126’473 | -46% |
Solar thermal energy (in kWh) | 203’808 | 94’890 | -53% |
District heating (in kWh) | 1’411’048 | 1’563’986 | 11% |
Total consumption | 3’341’564 | 2’918’528 | -13% |
Total electricity consumption and the proportion of renewable energies decreased slightly. Heating oil consumption fell by almost a quarter in the reporting year. The use of biogas is increasing, especially at the headquarters on Werdstrasse.
Expansion of the scope of data
Since 2022, our Sustainability Report has included sustainability data for Goldbach Neo Out of Home, JobCloud, Zattoo and Doodle.
More details on important categories
Environmental impact reporting has been expanded to include more detailed information on consumption of materials and energy.
Annual data comparison
These two improvements have an impact on annual comparability, as the data for 2023 was not retroactively augmented with data from the new companies and recalculated.